Statistic Trends and Their Meaning
If you know the meaning of a statistic graph, you can work out the correct condition for any activity. And if you know the condition, you will know what formula to apply to it. From there, it is simple to follow the steps of each formula and increase your statistics.
To understand statistics you must know about trends.
The word trend means the way the statistic generally goes—up, level or
When you are very close to the place where the statistic is worked on, you can more quickly change what is happening to the statistic.
For example, if you are a salesman in a large bookshop and your statistic measures the number of books you personally sell, then you should watch your statistic hour by hour.
If you are a head of a department in the bookshop, you manage your statistics on a daily basis.
But if you are the owner of the whole bookshop, you would need weekly statistics to manage the shop.
And if you are in charge of all the bookshops in the whole city, then you would watch the trend or direction of the statistic over weeks, so you can take the correct actions needed to guide their expansion.
Reading Stat Trends
Statistic trends can show anything from a Danger Condition to a Power Condition, depending on the direction of the graph and how steep it is.
Just by looking at it, you must average the high points and the low points of the statistic and in this way you will see the general direction of the graph.
Examples:
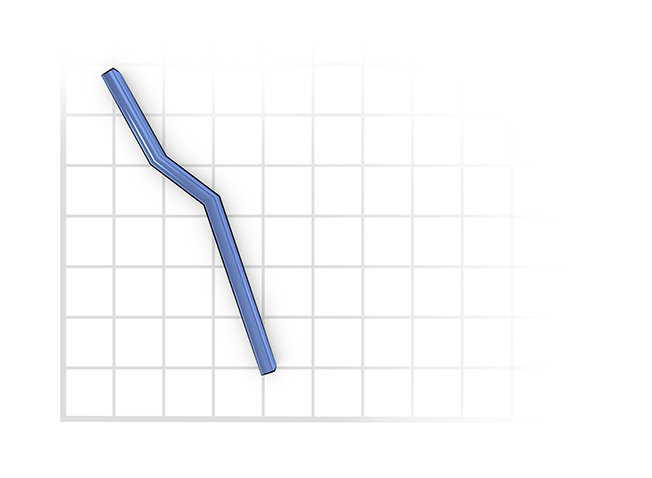
A Non-Existence trend would look like this:
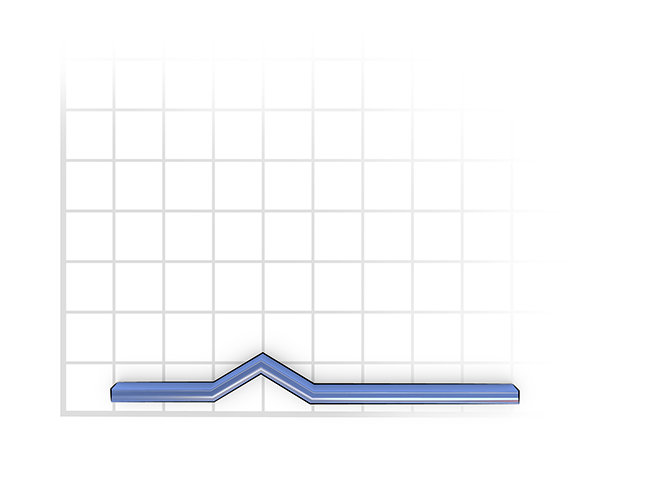
This would also be a Non-Existence trend:
This would be a Danger trend:

This would be an Emergency trend:
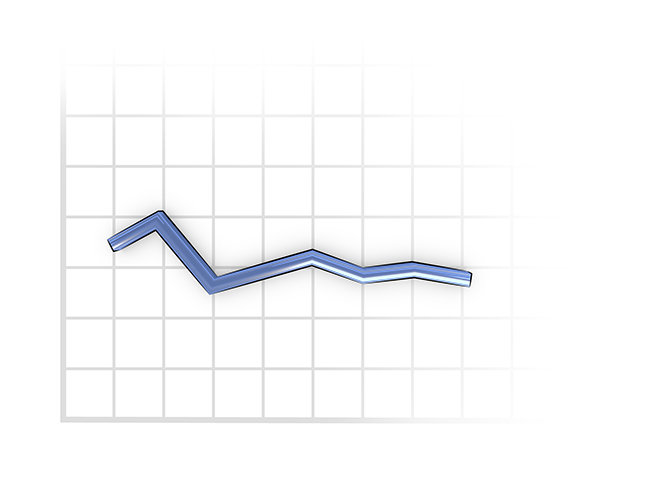
As you can see, it is not so steep.
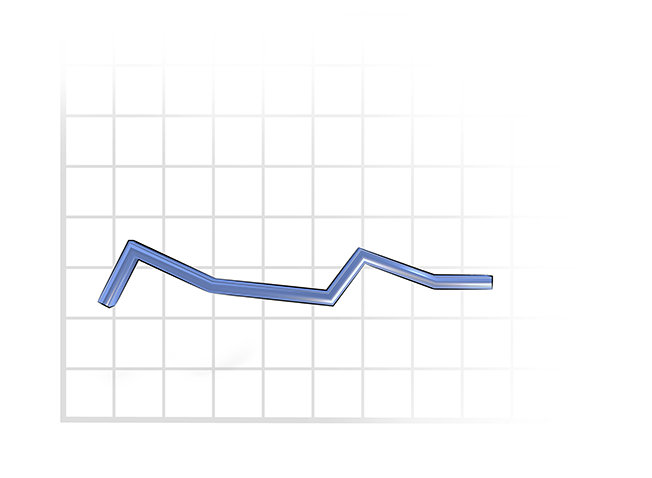
This would also be an Emergency trend as it will collapse—nothing stays level long.
This would be a Normal trend:
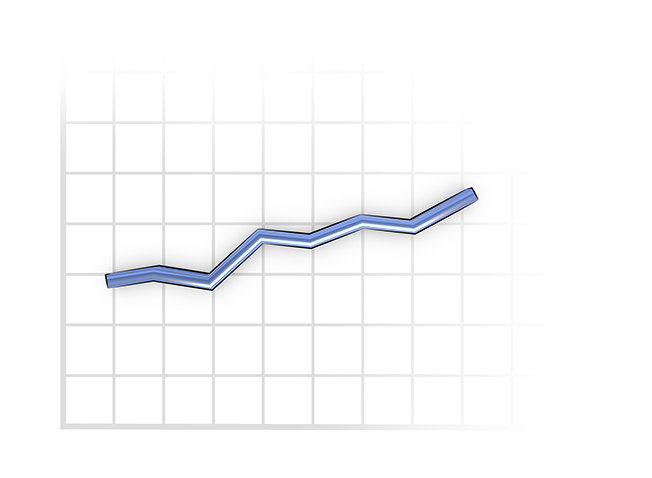
Any slight rise above level is Normal.
This would be an Affluence trend:

This would also be an Affluence trend:
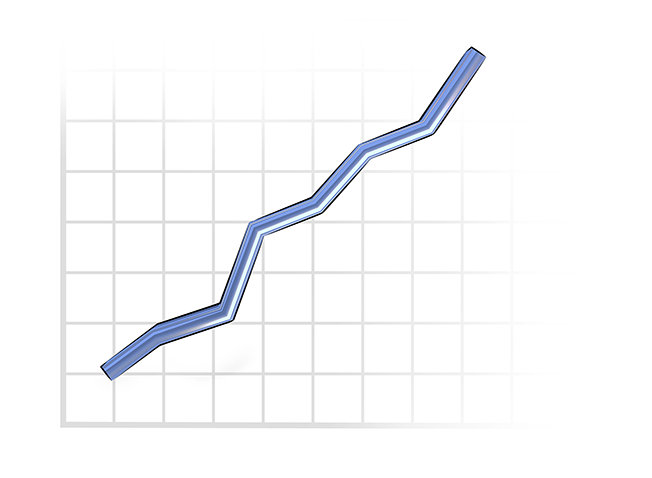
The graph is steeply Affluence trending.
This graph shows an Affluence going into Power:
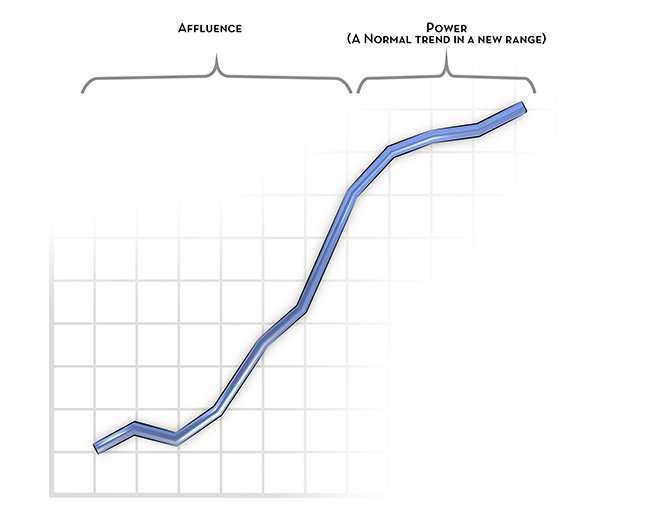
The Affluence trend has hit a new high range. Power is a Normal trend that is being maintained in a very, very high range.

